Designing Research
An often overlooked aspect of design is its ability to transform a previously negative product or experience into a positive one. I recently came across two examples that offer a good demonstration of this in the redesign of online quantitative research into more rewarding customer interactions.
Websites offer a way not only to create an advertising and selling environment but also the potential to access market research data from visitors. Going beyond Google analytics, a common feature of many sites, particularly high traffic media pages, is the on-line survey request. However, visitors are often unwilling to give up their time to provide opinions in online quantitative research questionnaires. It can be particularly annoying when a pop-up survey asks for feedback on a site as soon as it loads into the browser, before a first time viewer has had a chance to achieve what they went there to do.

Not only is there often little or no incentive to participate, there is a general public cynicism and reluctance to hand over any information online due to a mistrust over how that information might be used. There are plenty of research initiatives that include some form of prize as an inducement or even playing with the wording of the survey to invite users to be part of ‘an advisory panel’ to give more kudos to the act of taking part.
Two recent examples use design to create a different approach. The first is the New York Times ‘Personality Test.’ This is a pictorial selection process that focuses on personal preferences with a few questions about the New York Times thrown in. The user gets the feeling that the quiz is about them rather than the website. The reward for participating is an assessment of the image choices presented as a positive written description of your personality traits. This user benefit is effectively free once set up, no prizes required and every user who completes the survey gets to go away feeling good about themselves and who doesn’t want that?
The quiz/survey is set up under the VisualDNA™ brand from Imagini Europe Ltd, who have some IP on these processes. The company’s own online Charter notes that there may be a degree of cynicism from users and there is a path for the data to be used for targeted advertising but that appears to be in its early stages and as an opt-in rather than opt-out. However, in the New York Times case, they appear to create a positive outcome from something that might otherwise be seen as a chore.
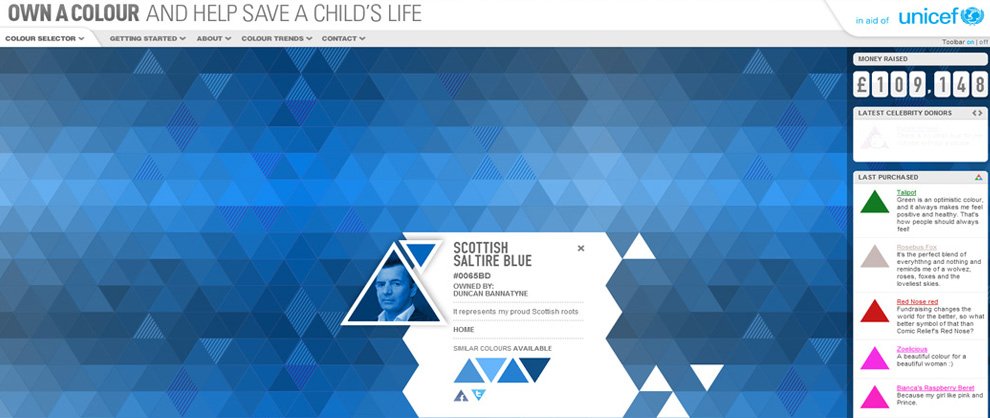
The second example ‘Own a Colour’ (www.ownacolor.com) is an interesting charitable initiative taken up by AkzoNobel owner of the Dulux brand. The idea is that people come on to the site and pay to sponsor (‘own’) a colour from £1 and up with the proceeds for UNICEF. With 16.7 million colours available, there is a big target for fundraising but one which has gained support. While primarily being a vehicle for charitable donating, the research survey potential is simple but powerfully executed.
The donors not only give money but also a little information including naming their colour, giving a reason for choosing it and describing it in a single word. So the Dulux brand rightly gains positive recognition of its philanthropic activity and also, should they choose to use it, access to an understanding on current male / female colour preferences by location and thousands of colour-associated names to help the marketing department in targeting new paint products. All the research is done in a positive environment where the participant is actively involved and so more likely to enter meaningful data.
Suitably impressed, Minima decided to ‘own’ the purple used in our logo. Look for #64E188 ‘Minima’ atownacolour.com